
A good cost per lead in Google Ads is one that still leaves the business with a profit after every expense. There is no universal number: 50 units is expensive in one niche, and 5,000 is cheap in another. The maths is simple: multiply the profit from one sale by the share of leads that turn into sales. Below I show how I run this calculation, what to do about repeat purchases, and how to check the number in your account.
Why a “market average” cost per lead won’t help you
When people ask me how much a lead should cost, they usually expect a figure from an industry report. I don’t use those figures, and here is why.
- Two companies in the same niche have different margins. Where one makes money, the other breaks even.
- Their lead-to-sale rates differ. A strong sales team can close several times more deals from the same flow of leads.
- Repeat demand differs. A one-off service and a monthly service can carry very different acquisition costs.
- Lead quality differs. Some reports count only paid orders, others count any button click.
Reports are useful for getting a sense of what Google Ads costs in general. But the decision on whether a lead is worth it can only be made with your own numbers.
The formula for your maximum cost per lead
Your maximum cost per lead is the ceiling above which advertising loses money. The formula looks like this:
Maximum cost per lead = average order value × margin × lead-to-sale rate
You need three numbers. Take them from the last 3-6 months, not from memory.
- Average order value. What one customer pays for one deal on average.
- Margin. The share of the order value left after cost of goods, staff pay, delivery and other costs per deal. It is better to factor in taxes and fixed costs too if you want a clean picture.
- Lead-to-sale rate. Take all leads for a period and see how many became payments. With 200 leads and 50 sales, the rate is 25%.
- Multiply the three numbers. The result is your ceiling.
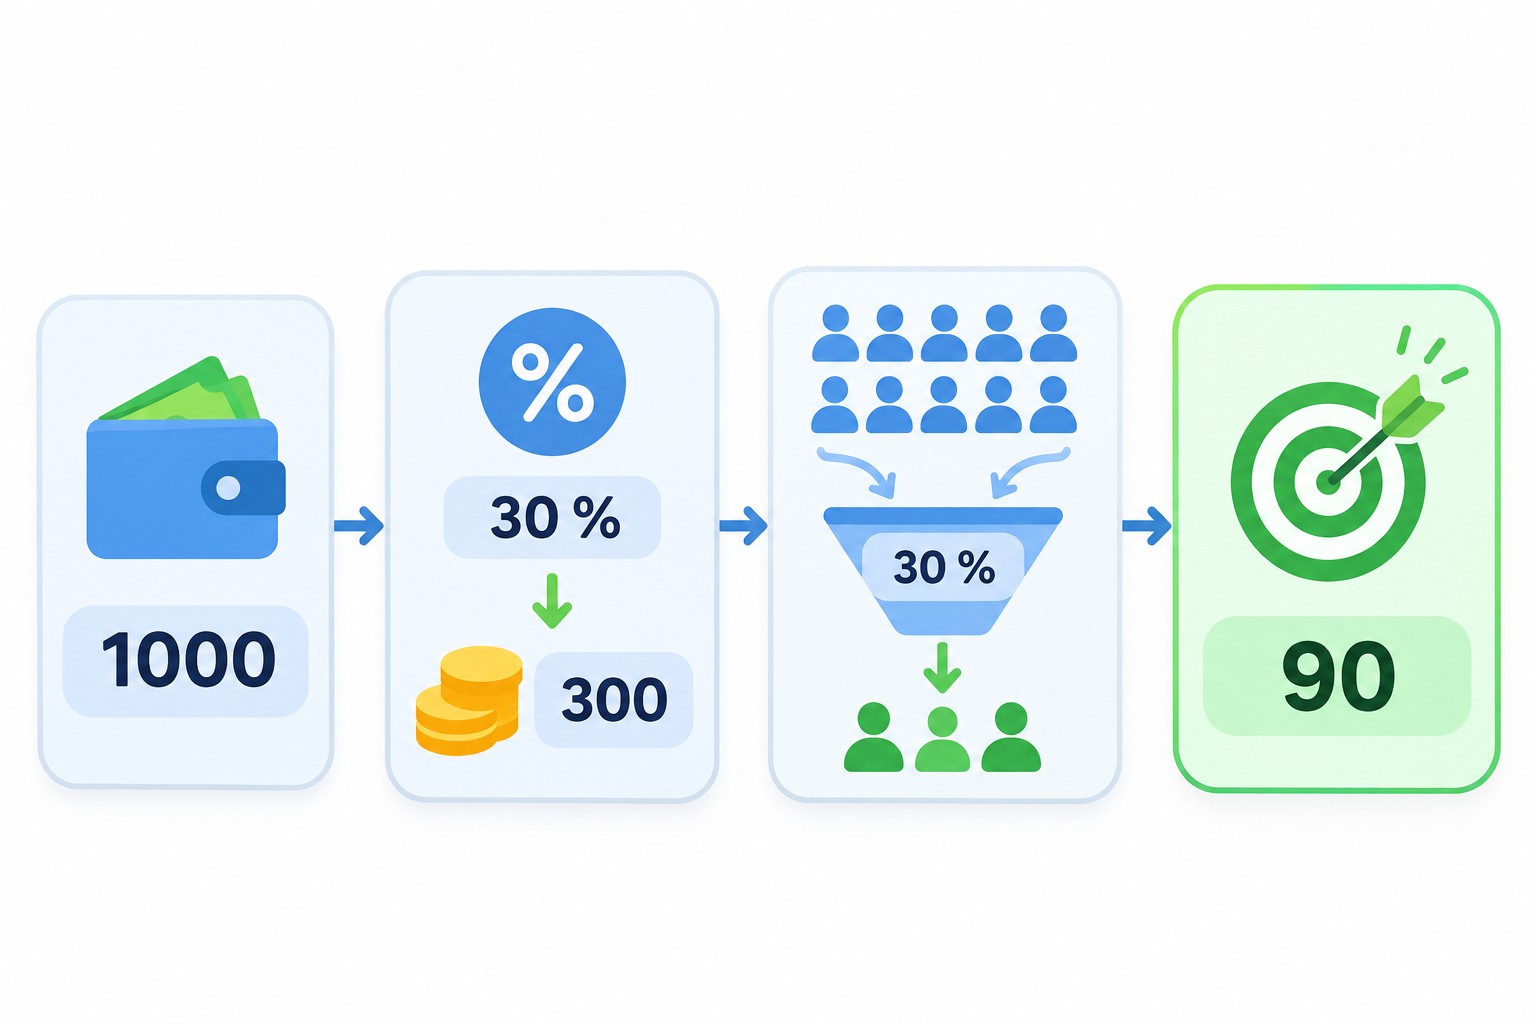
Here is an example with illustrative numbers. The average order is 1,000 and the margin is 30%, so one sale leaves 300. Out of 10 leads, 3 buy, so the rate is 30%. That gives 300 × 0.3 = 90. At 90 per lead you break even. Above that, every sale loses money.
Maximum and target cost are not the same thing
There is no point in running at the ceiling: the ads keep running, but the business earns nothing from them. That is why I always separate two numbers.
- Maximum cost per lead. The break-even point. Above it, advertising is in the red.
- Target cost per lead. The price at which you earn what you planned.
I usually set the target a third to a half below the maximum, but this depends on the niche and the goal. If the business wants profit now, the buffer is bigger. If the goal is to win market share quickly, the buffer can be smaller, as long as that is a deliberate decision and not an accident.
In the example above, with a ceiling of 90, the target would be around 45-60.
What to do if customers buy again
The formula above counts only the first sale. If customers come back, counting only the first order is a mistake: you understate what you can afford and lose to competitors who calculate more precisely.
In that case, replace the profit from one deal with the profit from a customer over the whole relationship. That is customer lifetime value, or LTV.
Two things to keep in mind.
- Calculate LTV on profit, not revenue.
- Use a realistic payback period. If a customer pays back in a year but your working capital lasts two months, the number looks good and doesn’t work.
How to calculate it for different types of business
The formula stays the same, but the inputs differ. Here is what I look at depending on the business.
One-off services
This is the simplest case: average order value, margin and the lead-to-contract rate. The most common mistake is counting consultations that were never going to become deals as leads. Calculate the rate on relevant enquiries, and track the share of irrelevant ones separately.
Online stores
A store usually looks at return on ad spend rather than cost per lead. The purchase is the conversion, and the goal becomes the share of revenue spent on advertising. The logic is the same: margin first, then the acceptable ad spend.
B2B and long deals
Here weeks or months pass between the lead and the money, and order values are usually high. Calculate cost per lead from your funnel over a past period and add an intermediate stage: how many leads became qualified. It shows ad quality sooner than payments do.
Seasonal businesses
If demand depends on the season, cost per lead will differ between peak and low months. I calculate the ceiling over a year, not a single good month. Otherwise it is easy to decide based on a short seasonal spike.
How to find out what a lead really costs
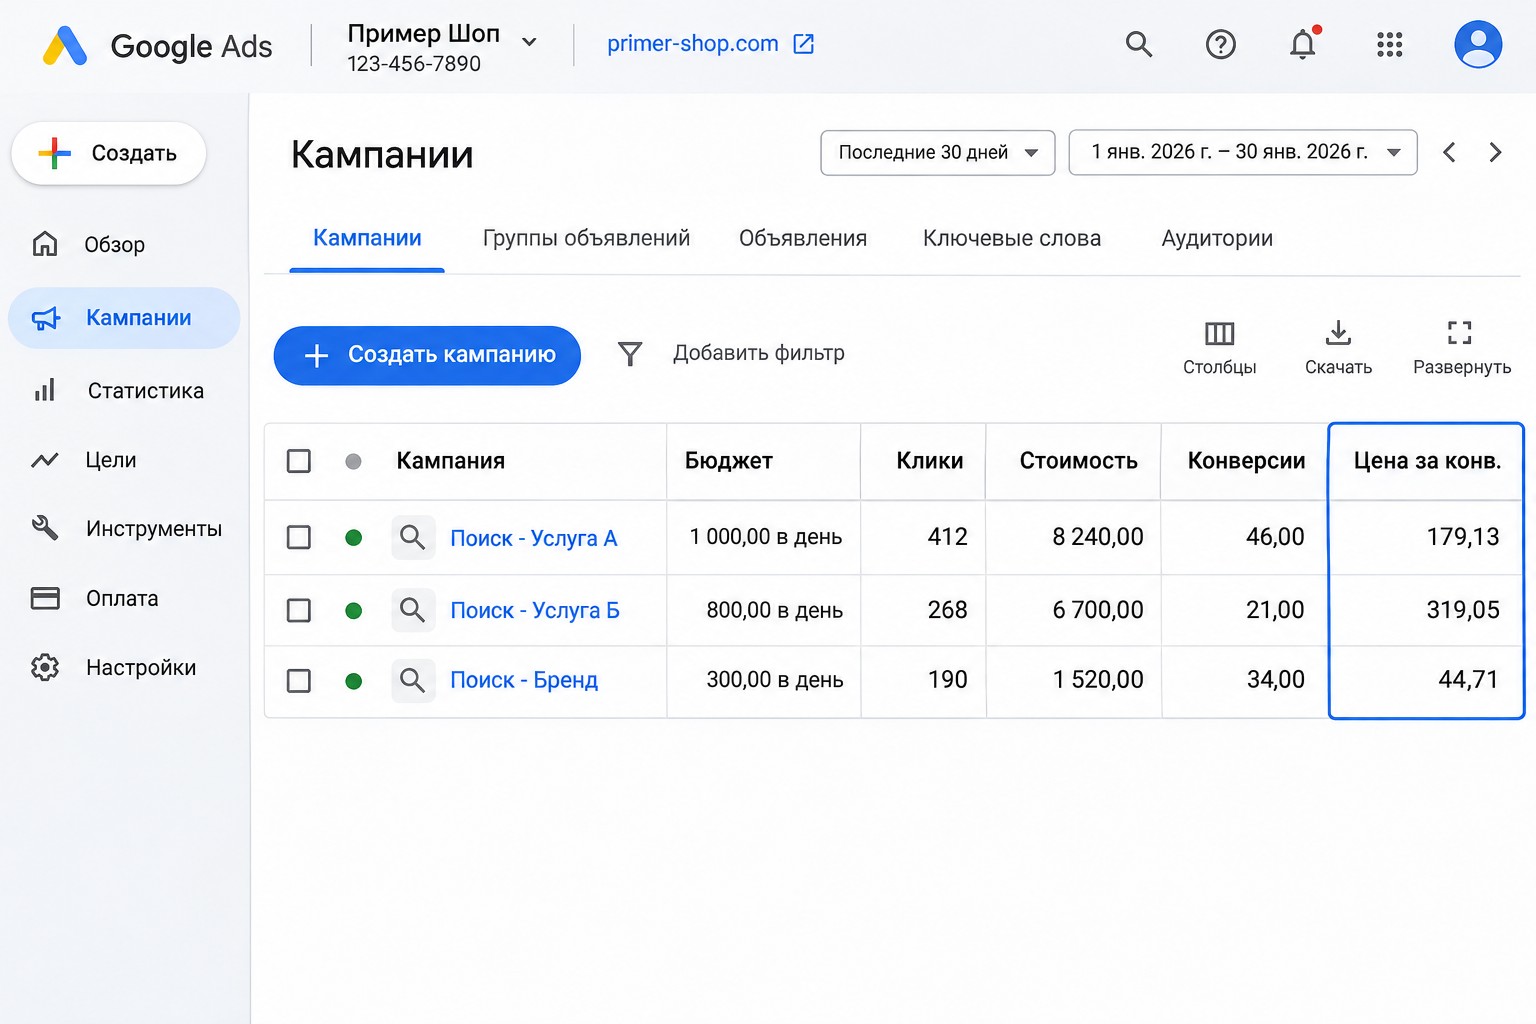
Google Ads shows this in the Cost / conv. column of the campaigns table. Here is how I read it.
- Open the campaigns view and choose a period of at least 30 days.
- Add the Conversions and Cost / conv. columns if they are not in the table.
- Compare the cost for each campaign with the target and maximum you calculated.
- Look at brand campaigns separately. They are almost always cheaper and flatter the account average.
This number is only correct if your conversions are set up properly. If contact page views or phone number clicks without a real call end up in that column, the cost per lead will look great and the money won’t follow.
So once a month I compare the report with the CRM, or at least a lead log. I check how many Google Ads conversions turned into real enquiries, and how many were spam, duplicates or irrelevant requests. The cost of a real lead is almost always higher than what the account shows.
How cost per lead connects to cost per click
Once you know your cost per lead, it is easy to see what click you can afford.
Maximum cost per click = target cost per lead × site conversion rate
If your target cost per lead is 60 and 5 out of 100 visitors leave a request, a click should not cost more than 3 on average. If a real click in your niche costs 6, the options are few: raise the site’s conversion rate, lower the cost per click, or rethink the economics. I covered working on click prices in detail in how to lower CPC in Google Ads.
How to pass the goal to Google Ads
Once you have the numbers, you can use them in campaign settings.
- Make sure conversions are tracked correctly and the main goal is marked as primary.
- Build up data. Google advises evaluating results over periods with at least 30 conversions.
- Choose the Target CPA bid strategy.
- Set the target close to your actual cost over the last month, then lower it gradually. If you set a target far below reality straight away, the campaign can lose impressions sharply.
One important change: since August 17, 2026, Target CPA campaigns limited by budget aim to stay closer to the set target. If a campaign used to run well below its target, the cost may drift up towards it. So don’t leave a generous target in place, and review it if it hasn’t changed for a while.
If you don’t have many conversions yet, start with a simpler strategy and watch your cost per lead manually.
What to do if leads cost too much
Don’t rush to switch the ads off. First find out where the money is being lost.
- Check your search terms. Junk traffic is the most common reason for expensive leads. The search terms report helps with this.
- Check the website. A weak page with an unclear offer noticeably cuts conversions.
- Compare campaigns. Sometimes one campaign eats the budget while another brings the leads.
- Look at your sales team. With plenty of leads and few sales, the problem may not be the ads.
- Recalculate the economics. It may make sense to raise prices, grow the average order or add an extra service.
Common mistakes
- Calculating from revenue. Leaving margin out of the formula inflates the cost per lead several times over.
- Treating any conversion as a lead. A click on a messenger button and a paid deal are worth different amounts.
- Looking at the account average. Brand makes it look good and hides losing campaigns.
- Drawing conclusions from 5-10 leads. At that volume, chance is stronger than any pattern.
- Forgetting about lag. In niches with long sales cycles, weeks pass between lead and sale, so results must be judged with that in mind.
- Comparing yourself with competitors. You don’t know their cost per lead, and their economics are different.
Frequently asked questions
What is the average cost per lead in Google Ads?
There is no single average. It depends on the niche, region, competition and website quality. Even within one niche, the spread can be huge, so it is safer to calculate the ceiling from your own economics.
What if I don’t know my lead-to-sale rate?
Start tracking it. Begin with a reasonable estimate, and replace it with a real number after a month. Without this figure, you can’t tell good advertising from bad.
Can I pay more than the maximum cost per lead?
You can, if it is a conscious investment: launching a new line, or counting on repeat purchases. But the decision should have a deadline and a budget, otherwise it is simply a loss.
What period should I use to judge cost per lead?
At least 30 days and at least 30 conversions. If you have few conversions, widen the period. With a long sales cycle, look at longer stretches.
Is cost per conversion the same as cost per lead?
Only if your conversions are real leads. If they include secondary actions, your cost per conversion will be lower than the real cost per lead.
Conclusion
Cost per lead comes from your economics, not the market: multiply the profit from a sale by the lead-to-sale rate, get the ceiling, and set a target with a buffer. After that, compare the number with real sales on a regular basis.
If you want to check what a lead really costs you and where your advertising loses money, order a free Google Ads express audit. I also publish no-nonsense breakdowns of advertising and analytics on my YouTube channel.